PROVIDER NETWORK CONTRACTING ________
Physician and Facility Reimbursements
Traditional insurance plans apply blanket reimbursement terms across thousands of providers nationwide, with conventional network contracts now regularly exceeding 250% of the benchmark Medicare rate of payment.
With medical costs trending at decade highs, HPX helps plan sponsors implement high-performance network contracting solutions that slow the rate of healthcare inflation and stabilize the cost basis for employee medical claims over the long term.

Accelerating Cost of Treatment
Inflationary trends are especially high in disease states that exceed $100K in average cost of treatment, with some categories trending ashigh as +42% year-over-year.
HPX arranges strategic network solutions to source fair-market value in these risk categories to reduce claim severity and renewal trend.

PHARMACY BENEFIT MANAGEMENT ________
Prescription Drug Spending
Prescription drug costs have trended over 11% per yearacross the pharmacy industry since 2023, representing the fastest-growing economic input for health plan spending.
While traditional health plans lock drug prices into a single broad contract channel, HPX integrates high-performance pharmacy benefit management vendors who empower plans to operate freely without the restraint of channel exclusivity, allowing the plan to source fair-market valueand mitigate rising drug costs head-on.

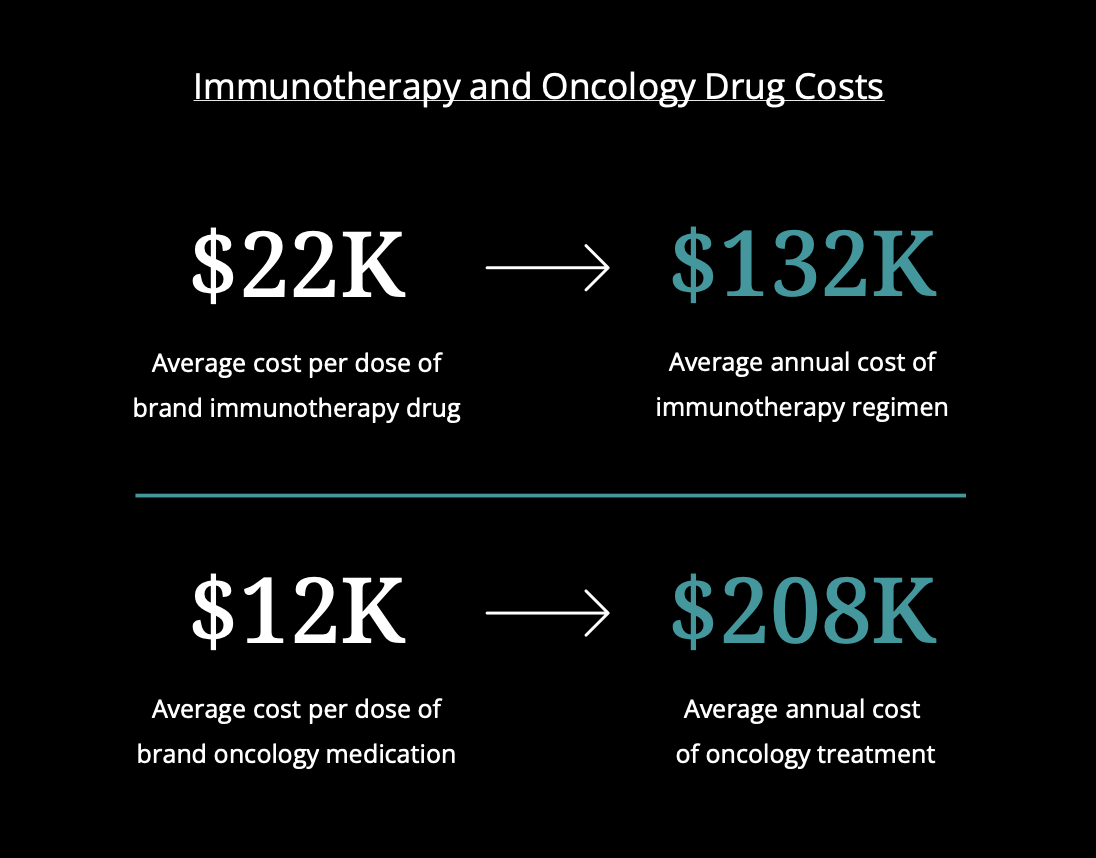
High-Cost Specialty Medications
Specialty medications now impose as much as six-figure financial impacts on employer health plans, with traditional pharmacy contracts doing little to contain these costs and passively absorbing substantial claim losses.
HPX equips the health plan with marquee pharmacy benefit management vendors who incorporate solutions such as biosimilar replacements, independent cost-plus platforms, and manufacturer-direct purchasing to achieve up to 75% savings in specialty medication spend.
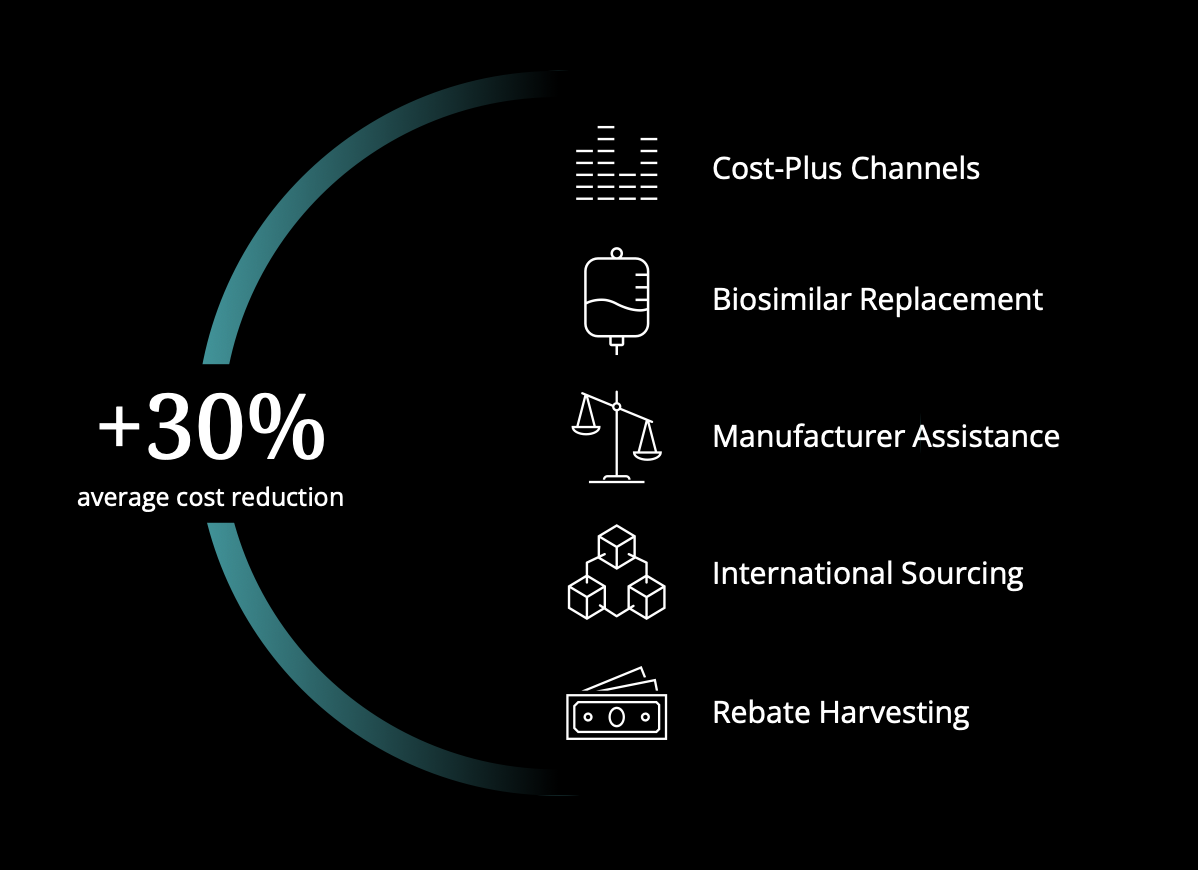
Multi-Channel Drug Sourcing
Amidst growing market pressures in the pharmacy industry, drug prices vary widely across different channels spanning cost-plus models, biosimilars, manufacturer assistance, international sourcing, and rebate-harvesting.
While traditional plans rely on singular carrier-owned pharmacy channels, HPX structures dynamic pharmacy benefit management solutions that allow employers to continually optimize all accessible sourcing channels and produce over 30% average savings in total drug spending.
THIRD-PARTY ADMINISTRATION ________
Dynamic Population Health Management
Health plan management is only effective as the third-party administrator's ability to address population health risks when they emerge.
While traditional health insurance plans automate claim processing to accommodate volume, HPx integrates specialized administrators who institute prudent financial governance across the plan ecosystem, actively managing patient cases and leveraging data analytics to anticipate future population health developments.

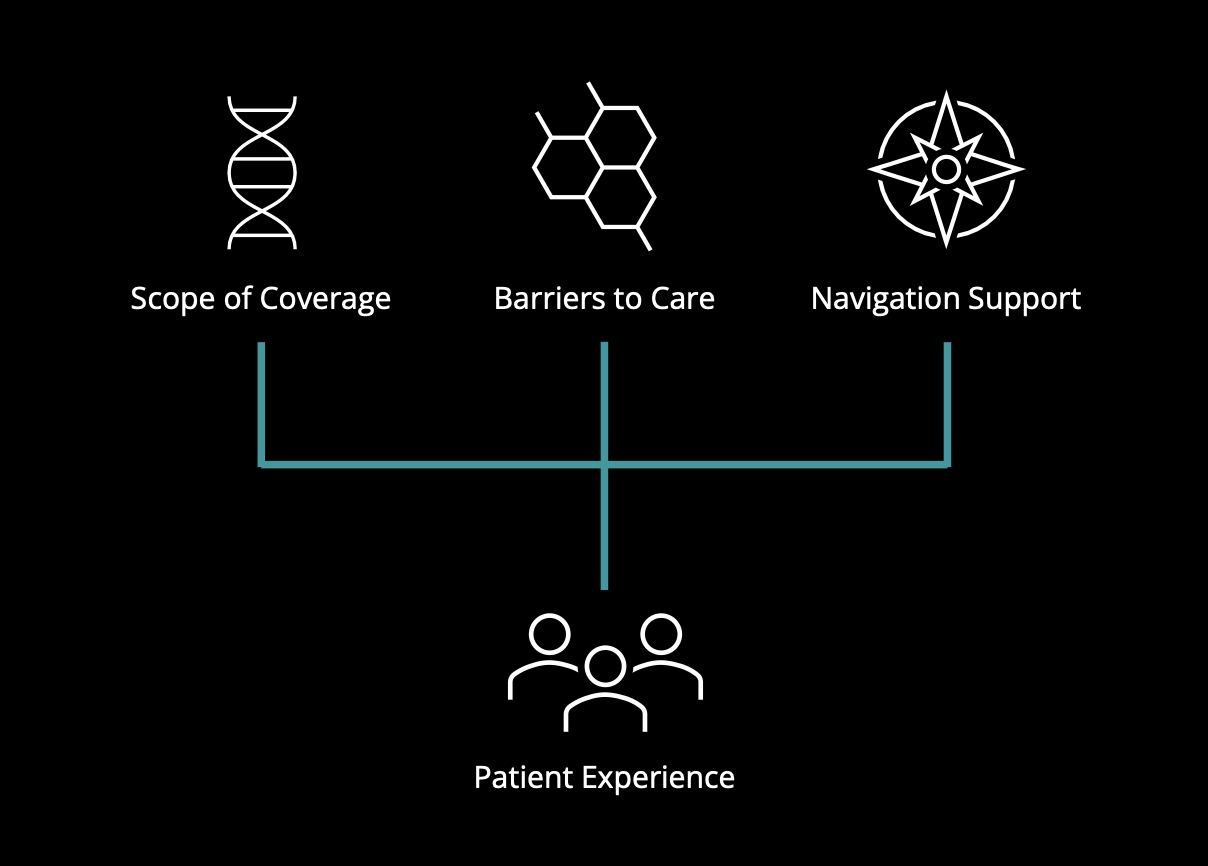
Command of Patient Experience
Not all health plan risks are financially-driven. Overall patient experience has been in steady decline over the last decade as employees grow frustrated with coverage exclusions, pre-authorization requirements, and complexity in navigating the healthcare system.
HPX unbundles rigid administration protocols from conventional insurance policies and restores patient controls to the plan sponsor directly, allowing the employer to dictate their own member experience.
INSURANCE & RISK FINANCE ________
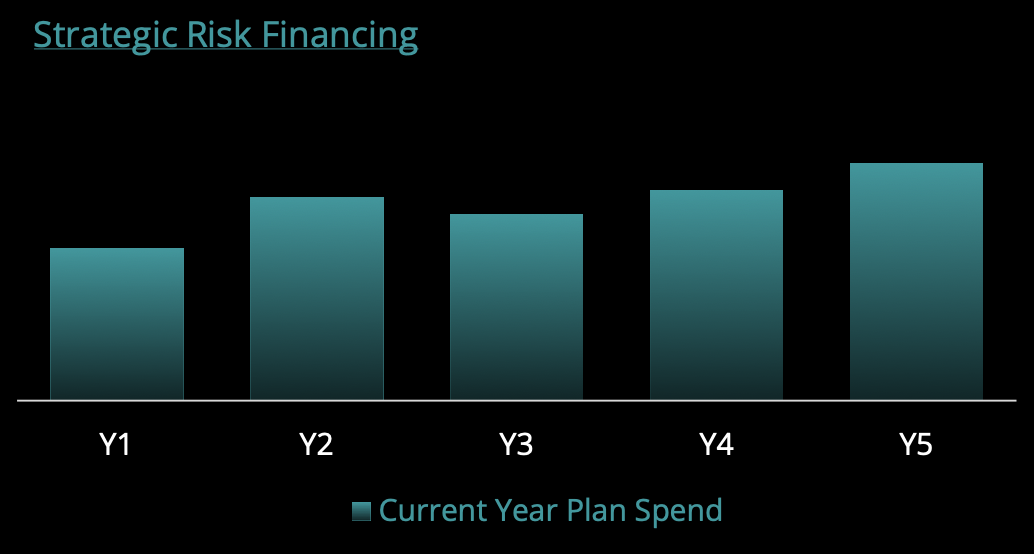
Strategic Risk Financing
Under traditional claim funding models, annual premium increases compound upon each other over time, resulting in irreversible, upward cost trend.

HPX designs strategic risk financing models to capture returns in low-utilization years while hedging against excess loss in high-utilization years.
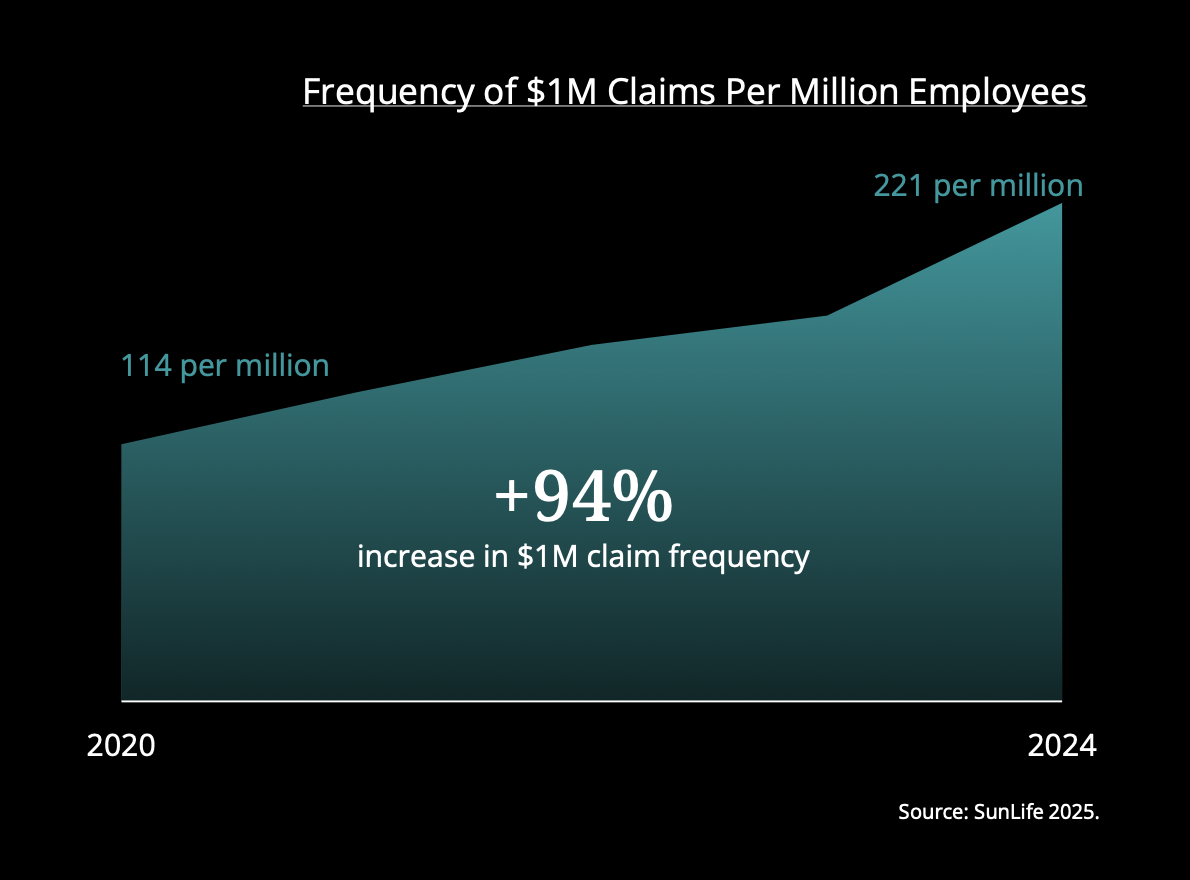
Catastrophic Claim Exposure
The frequency of +$1M claims nearly doubled between 2020 and 2024, driven by large increases in the cost of treatment for acute disease states.
Midsized employers often lack the membership volume to reasonably endure catastrophic losses. HPX helps these groups hedge catastrophic claim risk by purchasing insurance through multi-employer pools that produce the scale necessary to maintain solvency through these events.
Law of Large Numbers
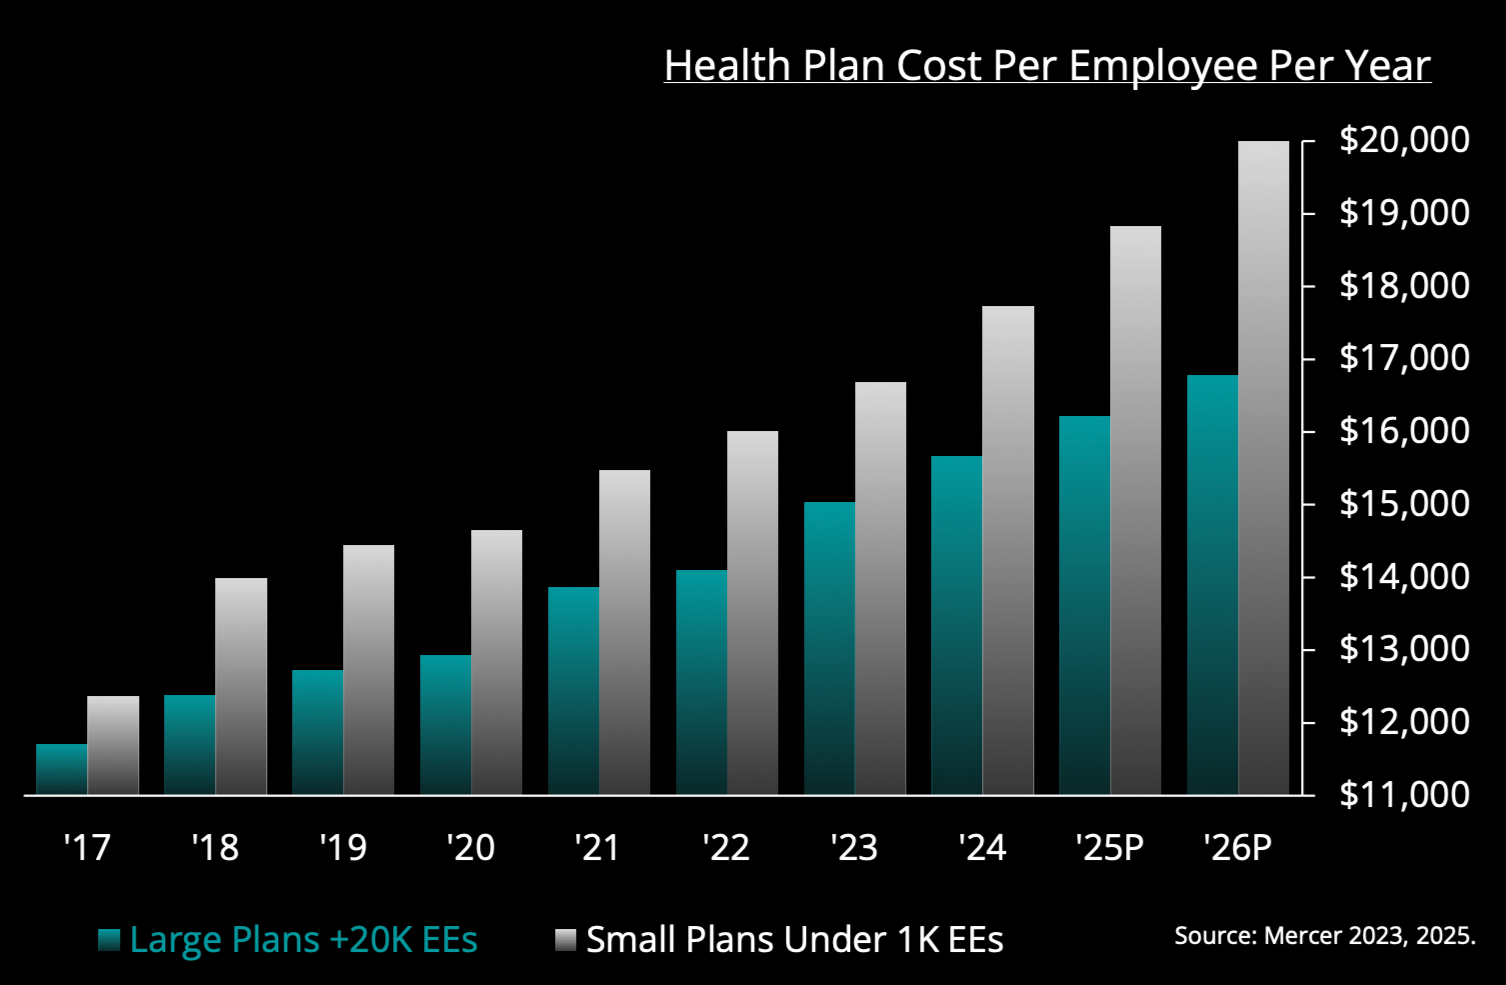
Large plans of 20,000+ members spend an average of 15% less per year than smaller plans of <1,000 members, driven by greater purchasing power and more predictable claim behavior across statistical mass.
HPX helps employers scale risk beyond their own population limits to reduce claim volatility and achieve the premium stability of a 100,000+ member population.